

Revered by PC enthusiasts, gamers, and professionals alike, HWiNFO has carved out a niche for itself as a reliable and detailed software solution for PC hardware diagnostics and monitoring. This guide aims to delve deep into its features, performance and overall utility to help you understand whether it’s the right tool for your needs. It also highlights the software application’s use cases and describes three scenarios.
Availability, Download and Setup
HWiNFO is free for personal use. There is also paid version available for corporations and other commercial purposes, which comes with additional features.
Make sure to download HWiNFO from the official website to ensure you are always getting the latest version from a reliable source. There is no guarantee that third-party mirrors deliver a safe experience, free of ads and malware.
HWiNFO is available in three versions – installer, portable and DOS – with no key differences between the three. The installer edition is the traditional method for setting up software, while the portable version is ideal for keeping HWiNFO stored on a USB flash drive to quickly deploy it on any computers directly from an external source. You can also add the portable edition to an emergency kit for hardware diagnostics. Lastly, the DOS version of HWiNFO is useful for legacy systems running DOS.
Key Features
What sets HWiNFO apart is its exhaustive hardware monitoring capabilities. It can track a wide range of data, including temperatures, voltages, fan speeds, and more, across various components. This level of detail is invaluable for those pushing their systems to the limit, such as overclockers and gamers.
In terms of system diagnostics, HWiNFO is a powerhouse. It offers in-depth reports that can help in identifying potential issues before they escalate. Plus, its compatibility across different hardware types and operating systems makes it a versatile choice.
System Summary
The System Summary in HWiNFO is a comprehensive overview of your computer’s hardware configuration and specifications. It provides detailed information about each component, allowing users to understand the exact make-up of their system. Here’s a breakdown of what you can typically expect in the System Summary section of HWiNFO:
CPU (Central Processing Unit)
- Processor model: The exact model of the CPU, including its series and generation.
- Core count and speed: Number of cores, threads, and the base operating speed.
- Architecture: CPU architecture, like x86, x64.
- Cache memory: Details of the processor’s L1, L2, and L3 cache sizes.
GPU (Graphics Processing Unit)
- Graphics card model: Details of the installed graphics card(s).
- Memory: GPU memory type and capacity.
- Core clock speeds: Speeds of the GPU core and memory.
- Driver version: The currently installed driver version for the GPU.
Motherboard
- Manufacturer and model: The brand and model number of the motherboard.
- BIOS version: The current version of the system’s BIOS or UEFI firmware.
- Chipset: Information about the motherboard’s chipset.
RAM (Random Access Memory)
- Memory capacity: Total installed RAM.
- Type and speed: Type of RAM (e.g., DDR4) and its operating speed.
- Module information: Details about each RAM module, like manufacturer, timings, and serial numbers.
Storage Devices
- Hard drives and SSDs: Models and capacities of installed storage devices.
- Interface: Information about the connection interface (e.g., SATA, NVMe).
Network Adapters
- LAN and WLAN adapters: Details of wired and wireless network adapters.
- Driver versions: Versions of the installed network drivers.
Audio Devices
- Sound cards: Information about integrated or dedicated sound cards.
- Driver information: Installed audio driver details.
Peripherals and Other Hardware
- USB devices: List of connected USB devices.
- Other devices: Information about other connected devices like webcams, printers, etc.
Operating System
- OS version: The version and build number of the installed operating system.
- System uptime: Duration since the last system boot.
Power Supply (If Detectable)
- PSU details: Information about the power supply unit, if available through sensors.
Sensor Information
- Real-time data: Quick access to real-time monitoring data for temperatures, voltages, fan speeds, etc.
Real-Time Monitoring
Real-time monitoring in HWiNFO is a crucial feature that provides live updates on various aspects of your computer’s performance and health. This feature is particularly important for detecting potential issues before they become serious, as well as for optimizing system performance. Here’s a detailed look at what real-time monitoring in HWiNFO entails:
Sensor Data Overview
- Temperature monitoring: Displays real-time temperatures of key components like the CPU, GPU, motherboard, and hard drives. This is vital for preventing overheating issues.
- Fan speeds: Shows the current RPM (revolutions per minute) of all the fans in your system, including CPU and case fans. This helps in assessing whether cooling systems are functioning correctly.
- Voltage readings: Tracks the voltage levels supplied to different components. Important for ensuring that the hardware is receiving the correct power and for diagnosing power-related issues.
- Clock speeds: Monitors the operating frequencies of the CPU, GPU, and RAM. This is particularly useful for those who overclock their systems to ensure stability.
Customization and Layout
- Customizable interface: Allows you to choose which sensors to display and hide the rest. This way, you can focus on the data that is most relevant to your needs.
- Graphs and gauges: Some readings can be displayed in graphical form, making it easier to spot trends or sudden changes in your system’s performance.
Alerts and Warnings
- Threshold alerts: You can set custom thresholds for various sensors. If a reading exceeds this threshold, HWiNFO can alert you. This feature is crucial for preventing damage due to overheating, overvoltage, or fan failure.
- Health status: Some sensors include health status indicators for components like SSDs and HDDs, alerting you to potential failures or deteriorating conditions.
Dynamic Data
- Load levels: Shows how much load is being put on the CPU, GPU, and memory. This helps in identifying bottlenecks or underutilization in your system.
- Battery information: For laptops, battery health, charge level, and wear level information can be monitored.
Data Logging
HWiNFO allows you to log sensor data over a period. This is useful for longer-term monitoring, post-analysis, or to keep a performance record during different operations like gaming or running heavy applications.
Use Cases
- Performance optimization: By monitoring real-time data, you can optimize your system for various tasks, ensuring that it runs efficiently and effectively.
- Troubleshooting: Helps in diagnosing issues by pinpointing when and where anomalies occur in your system.
- Overclocking: Essential for overclockers to monitor the impact of their adjustments on system stability and temperatures.
Logging and Analysis
Logging and analysis in HWiNFO are powerful features that allow users to record and examine various metrics over time. This functionality is particularly useful for diagnosing intermittent issues, understanding system behavior under different loads, and fine-tuning system performance. Here’s a detailed look at how logging and analysis work in HWiNFO:
Setting Up Logging
- Initiating logging: In HWiNFO, you can start a logging session by selecting the ‘Logging start’ option. This action prompts you to choose a location to save the log file.
- Configurable parameters: Before starting, you can configure what data to log. HWiNFO allows you to select specific sensors or data points you’re interested in, helping tailor the log file to your specific needs.
Data Collection
- Real-time data recording: Once logging is initiated, HWiNFO begins to record the real-time data from the selected sensors. This includes temperatures, voltages, fan speeds, load percentages, and more.
- Timestamps: Each data point is timestamped, allowing for precise tracking of system behavior over time.
Log File Format
- File types: The log files are typically saved in a CSV (Comma Separated Values) format, which is compatible with many applications, including spreadsheet software like Microsoft Excel or Google Sheets.
- Organized data: The data in the log file is organized in columns and rows, with each column representing a specific sensor and each row representing a different time stamp.
Analyzing Logged Data
- Opening in spreadsheet programs: You can open the CSV log file in a spreadsheet program for analysis. This allows you to sort, filter, and graph the data for better visualization.
- Identifying patterns and anomalies: By analyzing the logged data, you can spot trends, patterns, or anomalies. For example, you might notice temperature spikes during certain operations or voltage drops at specific intervals.
- Correlating events: You can correlate the data from HWiNFO with other events. For instance, if you experience system instability, you can check the log to see if there were any unusual readings at that time.
Use Cases for Logged Data
- Long-term performance monitoring: Logging allows for long-term monitoring of system health, which can be useful for tracking the effects of aging hardware.
- Troubleshooting intermittent issues: For intermittent issues that don’t show up in real-time monitoring, logs can be invaluable for diagnosing the problem.
- Benchmarking and overclocking: When benchmarking or overclocking, logs provide a detailed record of system performance and stability, helping in fine-tuning settings.
Data Sharing and Community Support
- Sharing logs: You can share log files with online communities or tech support for additional insights or troubleshooting assistance.
- Community analysis: The tech community, particularly in forums dedicated to hardware, often assists in analyzing such data, providing recommendations based on collective expertise.
Diagnostics and Troubleshooting
Diagnostics and troubleshooting using HWiNFO involve leveraging the tool’s comprehensive hardware monitoring capabilities to identify and resolve issues within a computer system. This process is critical for maintaining optimal system performance and longevity. Here’s a detailed approach to using HWiNFO for diagnostics and troubleshooting:
Understanding Baseline Performance
- Baseline metrics: Initially, it’s important to understand the normal operating ranges of your system’s components. This includes typical temperatures, fan speeds, voltage readings, and performance benchmarks.
- Regular monitoring: Use HWiNFO regularly to get familiar with what normal readings look like for your system, which will make it easier to spot anomalies.
Identifying Issues
- Abnormal readings: Be on the lookout for sensor readings that deviate significantly from the baseline. For example, higher-than-normal temperature readings can indicate cooling issues.
- System crashes and instability: If your system experiences crashes, blue screens, or other forms of instability, check HWiNFO logs (if enabled) around those times to identify potential causes.
Pinpointing Problems
- Temperature and cooling: High temperatures in CPU or GPU could indicate poor cooling, dust buildup, thermal paste degradation, or cooling system failure.
- Voltage fluctuations: Unstable or inappropriate voltage readings can signal power supply issues or failing components.
- Fan performance: Check fan speeds to ensure they are operating within expected parameters. Slow or non-functional fans can lead to overheating.
- Hardware failures: HWiNFO can also help diagnose failures in RAM, hard drives, and other components by showing discrepancies in expected performance or operation.
Conducting Stress Tests
- Using benchmarks: Run stress tests or benchmarks while monitoring HWiNFO to see how your system performs under load. This can reveal issues that aren’t apparent during normal usage.
- Real-time monitoring: Pay close attention to how temperatures, voltages, and fan speeds respond under these conditions.
Troubleshooting Steps
- Component isolation: Isolate which component is causing the issue. For example, if your GPU temperatures are consistently high, focus on the cooling solution for the GPU.
- Addressing cooling issues: Clean dust from vents, replace thermal paste, or upgrade cooling solutions as needed.
- Power supply check: If you suspect PSU issues, check the voltage readings and consider using a multimeter or a PSU tester for more precise diagnostics.
- Memory testing: Use tools like MemTest86 to check for RAM errors if HWiNFO indicates memory issues.
- Checking disk health: For storage-related issues, look at the SMART status and perform disk checks.
Additional Features
HWiNFO is a robust tool packed with numerous additional features that enhance its functionality beyond basic hardware monitoring. These features provide users with more control, customization, and in-depth information about their computer systems. Here’s an elaboration on some of these extra features:
- Customizable interface: HWiNFO allows users to personalize the layout and appearance of the interface, including the sensor monitoring windows. You can choose which sensors to display, adjust their order, and even change how data is presented.
- Remote monitoring: HWiNFO can be set up to allow remote monitoring of system statistics. This feature is particularly useful for managing multiple systems or for server administrators who need to monitor system health from a different location.
- Alerts and alarms: Users can configure HWiNFO to trigger alerts or alarms when certain parameters exceed predefined thresholds. This is essential for preventing damage due to overheating, overvoltage, or other critical conditions.
- Hardware analysis and protection: HWiNFO provides detailed insights into the hardware, offering more than just real-time data. It includes predictive failure analysis for certain components like HDDs/SSDs, utilizing SMART data.
- Extensive reporting: Users can generate extensive reports that include every piece of data HWiNFO collects. These reports are crucial for in-depth analysis, troubleshooting, or keeping records of system status.
- Sensor logging: HWiNFO allows for advanced data logging, capturing long-term performance trends or system behavior under specific conditions. This feature is invaluable for troubleshooting intermittent issues.
- External display and third-party integration: HWiNFO can integrate with third-party applications and tools, enhancing its functionality. For instance, it can work alongside fan control software or LCD/VFD display software to showcase system stats. Some configurations allow HWiNFO to connect with mobile apps, enabling users to monitor their system stats on their smartphones.
- Graphical display of sensor data: For a more intuitive understanding of the system’s performance, HWiNFO can display sensor data in graphical forms, making it easier to spot trends and anomalies.
- Broad hardware support: HWiNFO is constantly updated to support the latest hardware, ensuring that users with the newest components can still benefit from its comprehensive monitoring.
- OSD (On-Screen Display): For gamers and streamers, HWiNFO offers an in-game overlay feature that displays key system stats in real-time during gameplay.
How to Read HWiNFO Logs
Reading HWiNFO logs involves analyzing the data recorded during a monitoring session. These logs are typically saved in CSV (Comma Separated Values) format, which can be opened and analyzed using spreadsheet software like Microsoft Excel or Google Sheets. Here’s a step-by-step guide on how to read and interpret HWiNFO logs:
Step 1: Open the log file
Find the CSV file that HWiNFO created during your logging session. You would have specified the location when you initiated the logging. Next, open the CSV file in a spreadsheet program, such as Microsoft Excel, Google Sheets or Notepad++.
Step 2: Understand the layout
The log file is organized with each column representing a different sensor (e.g., CPU temperature, GPU temperature, fan speeds, voltages) and each row representing a different time interval. The first column typically contains timestamps indicating when each data entry was recorded. This helps in correlating the data with specific events or times.
Step 3: Inspect sensor data
Scroll through the columns to identify key metrics. For instance, if you are monitoring temperatures, locate the columns for CPU and GPU temperatures. Next, look for patterns in the data. For instance, if you were running a stress test, you might see temperatures rising during the test period. Then, identify any irregularities or spikes in the data that might indicate a problem. For example, a sudden increase in temperature or a drop in fan speed could signify an issue.
Step 4 (optional): Create graphs for visualization
In your spreadsheet program, select the data columns you want to visualize. Use the graphing or charting tools in the program to create a visual representation of the data. Line graphs are particularly useful for visualizing trends over time. Use the graphs to get a clearer picture of how the metrics changed over the duration of the log. This can make it easier to spot trends or issues.
Step 5: Cross-reference with events
Try to match spikes or drops in the logs with what you were doing on the system at that time. For example, if you notice a temperature spike, consider whether you were running a heavy application or game at that time.
Step 6 (for expert users): Perform advanced analysis
If you have advanced knowledge, you can delve deeper into more complex data, like voltage fluctuations or clock speed variations.
Example: The GPU voltage occasionally drops significantly below the expected range during a stress test. When plotting the voltage data on a graph, there’s a pattern of sharp dips corresponding with moments of peak GPU load. After analyzing the clock speed data for both the CPU and GPU, you notice that each time there’s a voltage drop, the GPU clock speed also drops (known as throttling). This suggests that the GPU is not receiving sufficient power under load, leading to performance dips. The issue might be related to an inadequate power supply unit (PSU) or a faulty GPU power regulation system. To address it, first replace the PSU with a higher-wattage and more reliable model. Then rerun the tests and check the HWiNFO logs again. If the voltage remains stable this time and there are no significant drops in the GPU clock speed, then the power supply was indeed the culprit.
HWiNFO Uses and Test Cases
HWiNFO, with its comprehensive hardware monitoring and diagnostic capabilities, can be utilized in a variety of scenarios, benefiting a wide range of users. Here’s a table summarizing the various use cases for this software:
| Use Case | Description | How HWiNFO Helps |
|---|---|---|
| Overclocking optimization | Gamers or PC enthusiasts overclocking their CPU/GPU for enhanced performance. | Monitors temperatures and voltages, ensuring stability and safety during overclocking. Provides feedback for fine-tuning. |
| System health checkups for IT professionals | IT administrators conducting routine health checkups of systems in an organization. | Offers detailed reports and predictive hardware failure analysis for proactive maintenance. |
| Thermal management for high-performance PCs | Managing thermal performance in high-performance gaming or workstation PCs. | Tracks CPU/GPU temperatures, fan speeds, and thermal throttling. Alerts about potential overheating issues. |
| Hardware troubleshooting | Diagnosing hardware-related issues like system crashes, freezes, or performance issues. | Identifies failing components or abnormal behavior through in-depth hardware analysis and real-time monitoring. |
| Benchmarking and performance testing | Conducting benchmarks for performance comparison or after hardware upgrades. | Provides system specifications and monitors hardware during benchmarks for a comprehensive performance view. |
| Custom PC building and upgrades | PC builders and enthusiasts planning system upgrades or new builds. | Gives a complete hardware overview, aiding in compatible upgrades and new build decisions. |
| Remote system monitoring | Remote monitoring of systems for temperature, performance, and health, especially for servers. | Enables remote monitoring, ensuring optimal functioning of servers or remote PCs. |
| Educational purposes and learning | Students or individuals learning about computer hardware. | Acts as an educational tool, offering insights into hardware functions and interactions. |
| Long-term performance analysis | Monitoring the long-term performance and degradation of computer systems. | Allows for the analysis of long-term trends in system performance and component wear through extended data logging. |
| Content creation and streaming | Content creators and streamers needing to monitor system performance during demanding applications. | Provides real-time data overlays during content creation or streaming, ensuring optimal performance without disrupting the workflow. |
HWiNFO Test Case for Overclocking Optimization
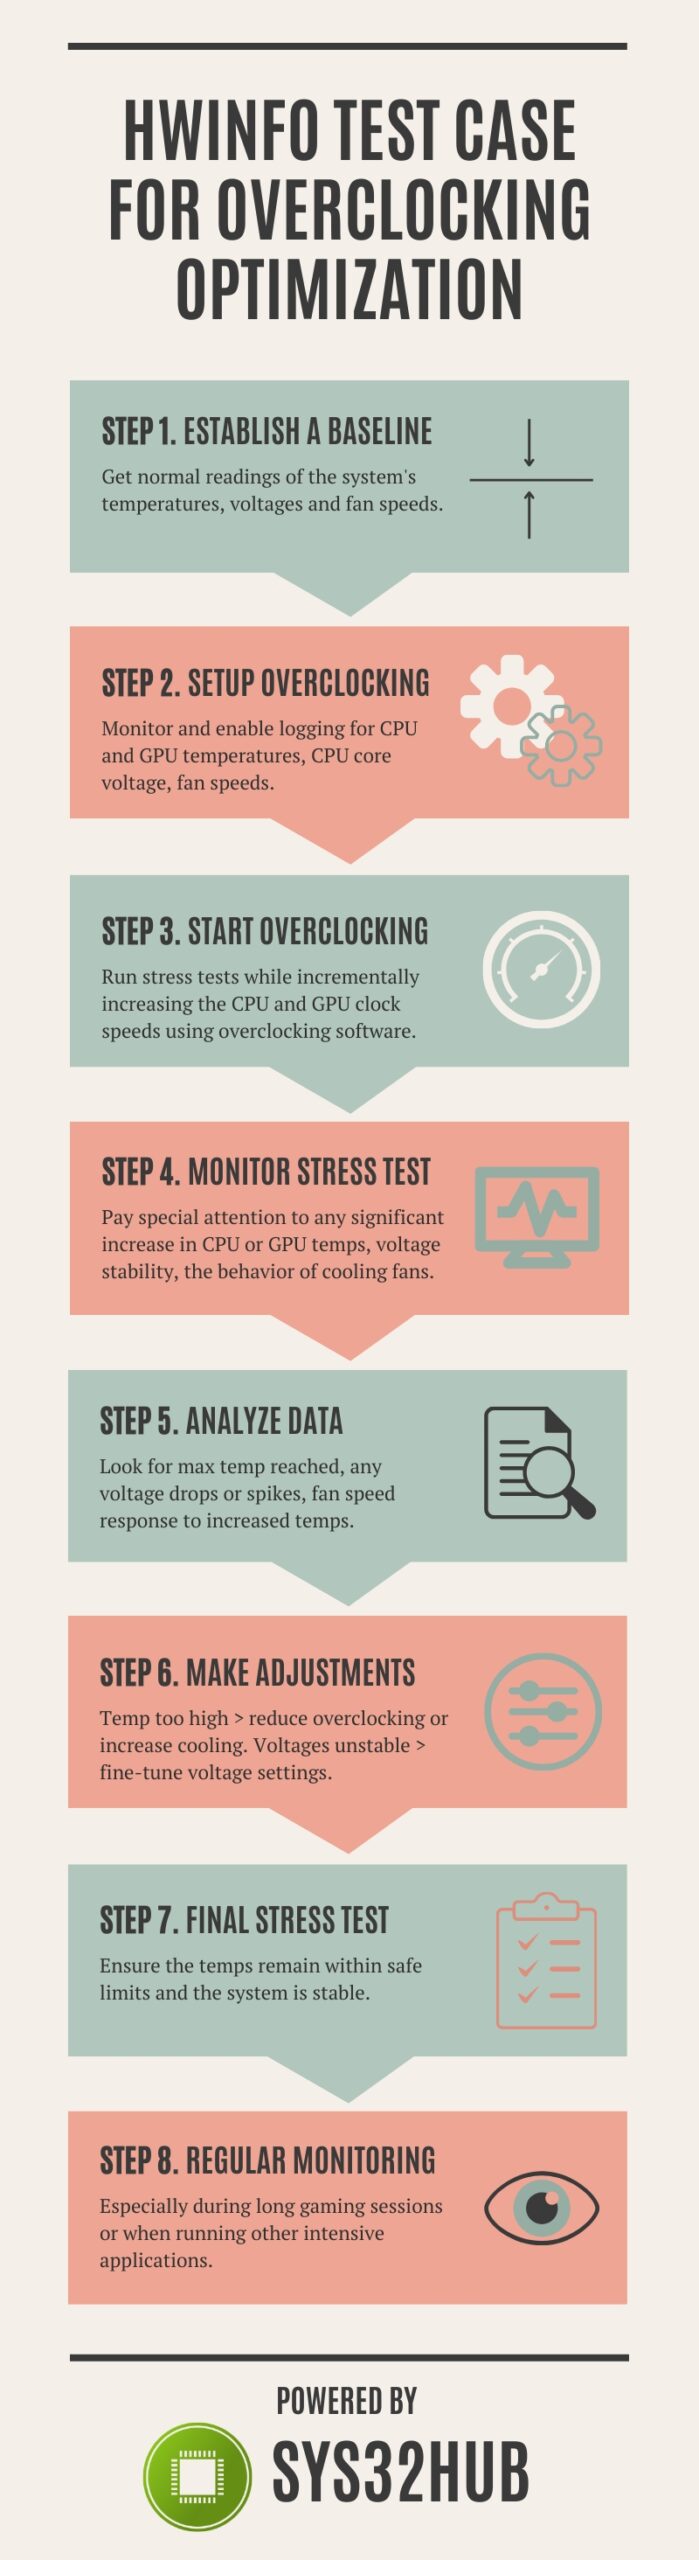
Background: A PC enthusiast, John, wants to overclock his gaming rig to achieve higher performance. He understands that overclocking can increase the risk of overheating and instability, so he decides to use HWiNFO to monitor his system during the process.
Here’s an infographic that summarizes the steps for this overclocking optimization scenario using HWiNFO:
Check out the detailed steps for this overclocking optimization test case:
Step 1: Establish a baseline
Before overclocking, John runs HWiNFO to get baseline readings of his system’s temperatures, voltages, and fan speeds under normal operation.
Step 2: Configure HWiNFO for overclocking
John sets up HWiNFO to monitor key parameters:
- CPU and GPU temperatures
- CPU core voltage
- Fan speeds
He enables logging to record these parameters over time for later analysis.
Step 3: Start the overclocking process
John incrementally increases the CPU and GPU clock speeds using overclocking software.
After each increment, he runs a stress test to put a load on the CPU and GPU.
Step 4: Monitor during stress tests
While the stress tests are running, John closely observes the HWiNFO readings. He pays particular attention to:
- Any significant increase in CPU or GPU temperatures
- Voltage stability
- The behavior of cooling fans
Step 5: Analyze the data
After each test, John reviews the HWiNFO logs to see how the temperatures and voltages behaved over time. He looks for:
- Maximum temperature reached
- Any voltage drops or spikes
- Fan speed response to increased temperatures
Step 6: Make adjustments
Based on the HWiNFO data, John adjusts the overclocking settings:
- If temperatures are too high, he reduces the overclocking intensity or improves cooling (e.g., by increasing fan speed, enhancing case ventilation, or reapplying thermal paste).
- If voltages are unstable, he fine-tunes the voltage settings to achieve a balance between stability and performance.
Step 7: Run and monitor a final stress test
Once John is satisfied with the overclock settings, he conducts a final, extended stress test while monitoring with HWiNFO. He ensures that temperatures remain within safe limits and the system is stable.
Step 8: Perform regular monitoring
Even after successful overclocking, John uses HWiNFO regularly to monitor his system, especially during long gaming sessions or when running other intensive applications.
HWiNFO Test Case for Hardware Troubleshooting
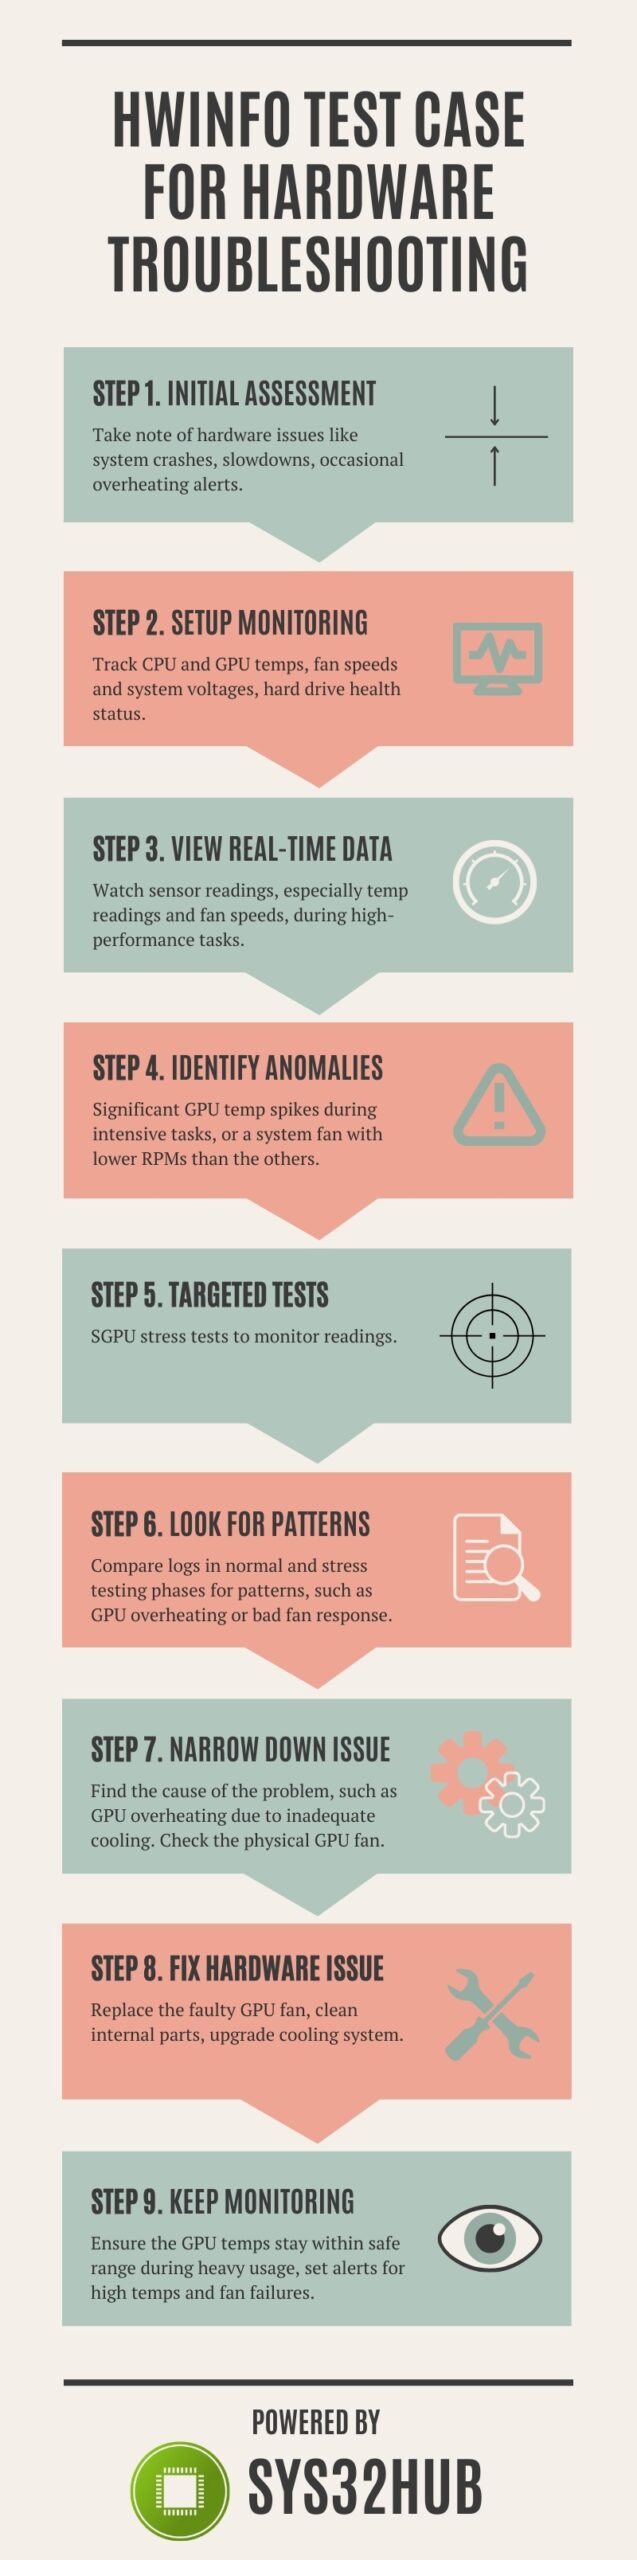
Background: Emma, a digital artist, experiences sudden system crashes and performance lags while working on her high-end workstation. Suspecting hardware issues, she decides to use HWiNFO to diagnose the problem.
Here’s an infographic that summarizes the steps for this hardware troubleshooting scenario using HWiNFO:
Check out the detailed steps for this hardware troubleshooting test case:
Step 1: Run an initial assessment
Emma first notes the symptoms:
- System crashes
- Slowdowns
- Occasional overheating alerts
She decides to monitor the system’s hardware components using HWiNFO to pinpoint the issue.
Step 2: Set up HWiNFO for monitoring
Emma launches HWiNFO and configures it to monitor critical parameters:
- CPU and GPU temperatures
- Fan speeds and system voltages
- Hard drive health status
Step 3: Observe real-time data
While working on her projects, Emma keeps an eye on the HWiNFO sensor readings.
She particularly focuses on temperature readings and fan speeds during high-performance tasks.
Step 4: Identify anomalies
Through HWiNFO, Emma notices that her GPU temperatures spike significantly during intensive tasks, exceeding normal operating ranges. She also observes that one of her system fans shows much lower RPMs compared to others.
Step 5: Conduct targeted tests
To confirm her suspicions, Emma runs a series of stress tests specifically on the GPU.
She continues to monitor the HWiNFO readings closely during these tests.
Step 6: Analyze logs for patterns
Emma reviews the logs recorded by HWiNFO during her normal usage and the stress tests.
The logs confirm consistent overheating of the GPU and inadequate fan response.
Step 7: Narrow down the issue
Based on HWiNFO data, Emma concludes that the GPU overheating is likely due to inadequate cooling. She checks the physical GPU fan and discovers that it’s malfunctioning, leading to poor cooling.
Step 8: Resolve the hardware issue
Emma replaces the faulty GPU fan and cleans the internal components to improve airflow.
She also decides to upgrade her cooling system for better thermal management.
Step 9: Keep monitoring after troubleshooting
After addressing the cooling issue, Emma continues to use HWiNFO to ensure that her GPU temperatures stay within a safe range during heavy usage. She also sets up alerts in HWiNFO for high temperatures and fan failures to prevent future issues.
HWiNFO Test Case for Benchmarking and Performance Testing
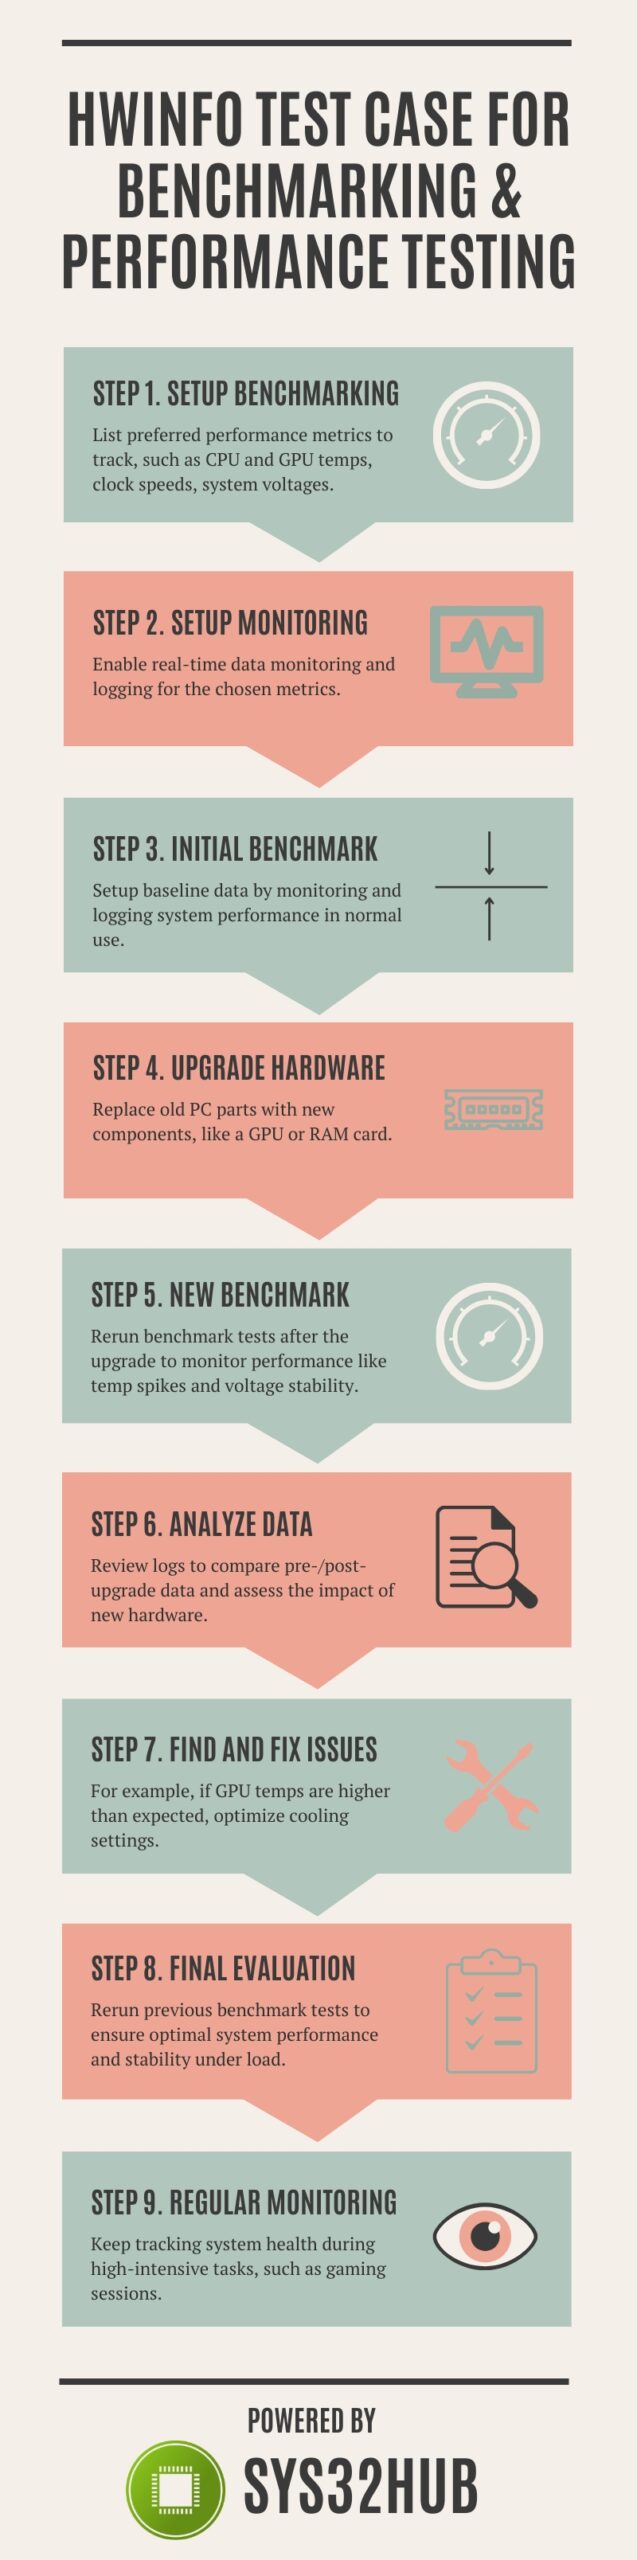
Background: Henry, a tech enthusiast, has recently upgraded his gaming PC with new hardware components. He wants to benchmark the new setup to evaluate performance improvements and ensure system stability under load. He decides to use HWiNFO alongside his benchmarking tools.
Here’s an infographic that summarizes the steps for this benchmarking and performance testing scenario using HWiNFO:
Check out the detailed steps for this benchmarking and performance testing test case:
Step 1: Prepare for benchmarking
Henry lists the performance metrics he wants to track:
- CPU and GPU temperatures
- Clock speeds
- System voltages
He installs the latest version of HWiNFO and familiarizes himself with its sensor monitoring features.
Step 2: Set up HWiNFO for monitoring
Henry configures HWiNFO to display real-time data for the chosen metrics. He enables data logging in HWiNFO to record the system’s performance throughout the benchmark tests.
Step 3: Run initial benchmarks
Before testing the new setup, Henry runs benchmarks on the existing setup to establish baseline performance data. He uses HWiNFO to monitor and log system performance during these initial tests.
Step 4: Upgrade hardware
Henry upgrades his PC with the new components (e.g., a faster GPU, additional RAM).
Step 5: Run post-upgrade benchmarks
With the new hardware installed, Henry runs the same set of benchmark tests again.
He closely monitors the system’s performance using HWiNFO, paying special attention to temperature spikes and voltage stability.
Step 6: Analyze performance data
After completing the benchmarks, Henry reviews the HWiNFO logs. He compares the pre and post-upgrade data to assess the impact of the new hardware on system performance and stability.
Step 7: Identify issues and make adjustments
Henry notices higher-than-expected temperatures on the new GPU during intensive tests.
Based on the HWiNFO data, he optimizes the cooling system settings and reruns the benchmarks to ensure the modifications have the desired effect.
Step 8: Make a final evaluation
Satisfied with the cooling adjustments, Henry conducts a final round of benchmark tests while monitoring with HWiNFO. He verifies that the system maintains optimal performance and stability under load.
Step 9: Ensure regular monitoring for long-term performance
After completing the benchmarking and optimization process, Henry plans to use HWiNFO regularly to keep an eye on system health during gaming sessions.
Pros and Cons
HWiNFO is a popular system information and diagnostics tool known for its comprehensive hardware analysis. Like any software, it comes with its own set of advantages and limitations. Below are the pros and cons of using HWiNFO:
Pros of HWiNFO
- Detailed insights into nearly every aspect of a computer’s hardware
- Real-time data on system temperatures, voltages, fan speeds and other critical parameters
- Custom alerts for various parameters to preemptively address potential hardware issues
- Customizable interface
- Data logging and reporting
- Free and portable versions available
- Regular updates and broad hardware support
- Supports integration with other applications, such as Rainmeter or fan control software, to enhance its utility
Cons of HWiNFO
- The sheer amount of information provided can be overwhelming for casual users or those not familiar with hardware terminology
- Unlike some other tools, HWiNFO primarily focuses on monitoring and reporting, and it doesn’t offer extensive features to control or modify hardware settings
- While generally lightweight, running HWiNFO with many sensors active or in the background can consume system resources, potentially impacting system performance on older or less powerful machines
- In rare cases, there might be compatibility issues with certain hardware components or configurations, leading to inaccurate readings or failure to detect some sensors
- HWiNFO is designed primarily for Windows, which means Mac or Linux users cannot benefit from its features
Frequently Asked Questions (FAQs) about HWiNFO
Is HWiNFO safe?
Yes, HWiNFO is considered safe to use. It is a reputable software widely used in the PC enthusiast community. As with any software, ensure you download it directly from the official HWiNFO website to avoid the risk of downloading malware from third-party sites. The program itself does not make any changes to your system hardware; it only reads and displays information.
Is HWiNFO accurate?
Yes. HWiNFO is known for its accuracy in monitoring system information. It provides detailed and precise data regarding temperatures, voltages, fan speeds, and other system metrics. However, the accuracy can sometimes depend on the sensors and hardware of the specific system. Generally, HWiNFO is trusted for providing reliable data.
How to update HWiNFO?
To update HWiNFO, follow these steps:
- Visit the official HWiNFO website.
- Download the latest version of the software.
- If you are using the installable version, run the installer, and it will update your existing installation. If you are using the portable version, simply replace the old executable file with the new one.
- Optionally, HWiNFO may also notify you of new updates when you open the application, with an option to download the latest version directly.
What’s the difference between HWiNFO and HWMonitor?
HWiNFO and HWMonitor are both system monitoring tools, but they have some differences:
- Depth of information: HWiNFO is known for providing more detailed information about the system, including more in-depth hardware analysis, support for a wider range of sensors, and extensive data logging capabilities.
- User interface: HWiNFO offers a more customizable interface compared to HWMonitor, allowing users to tailor the data display to their needs.
- Functionalities: HWiNFO often includes additional features like remote monitoring, custom alerts, and integration with other software, which may not be present in HWMonitor.
- Target audience: While both tools cater to enthusiasts and professionals, HWiNFO’s extensive data and customization options might be more aligned with the needs of power users and professionals. HWMonitor, on the other hand, offers a simpler interface that might be more suitable for casual users or those needing basic monitoring functionalities.
Conclusion
To recap, HWiNFO stands as a highly versatile and powerful tool for hardware diagnostics and monitoring, catering to a wide spectrum of users from PC enthusiasts and gamers to professionals. Whether you are troubleshooting a specific issue, aiming to push your system to its limits or simply keeping an eye on your PC’s health, HWiNFO provides the necessary tools and data to achieve your goals effectively and efficiently.